Menu
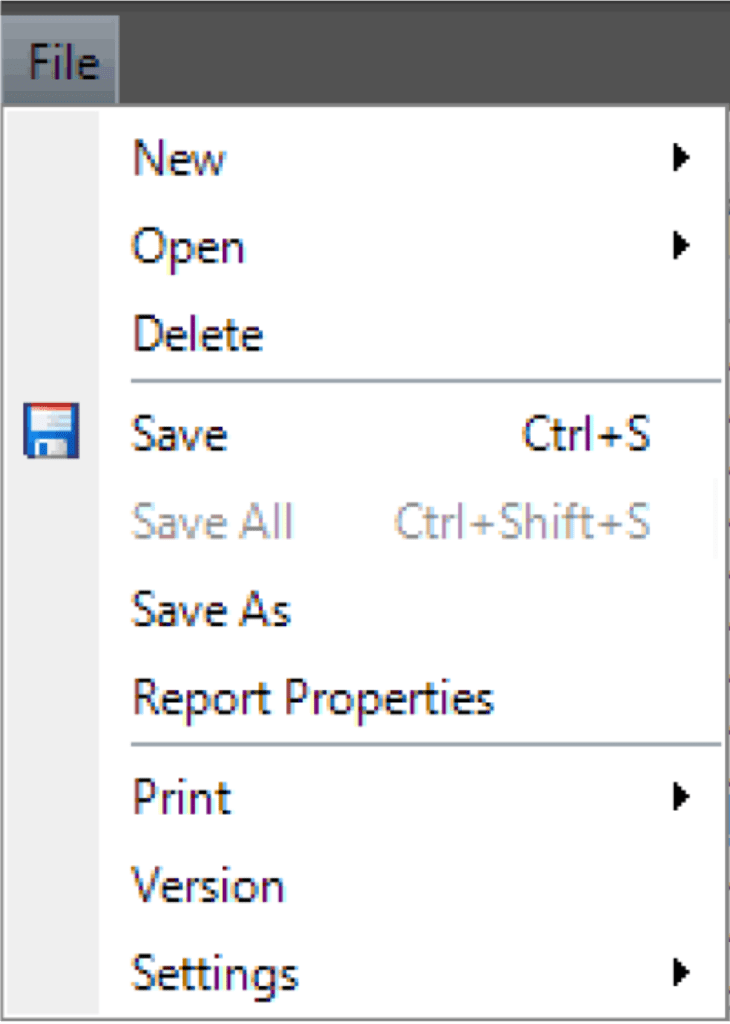
- New: Create a new report.
- Open: Open a report or snapshot.
- Delete: Delete the current report.
- Save: Save changes to the report.
- Save As: Saves the report under a new name and category.
- Report Properties: View and manage report details.
- Print: Preview and print the report.
- Version: Displays the PastaReport version.
- Settings: Accesses report troubleshooting and administrative tools, including:
- Logging: Opens the Report Debugger for detailed logging.
- Broken Report Links: Reassign reports that have lost their original user link.
- Work Week Snapshot Settings: Define which crews are permitted to take weekly graphic snapshots.
Open Existing Report

Access reports that have already been created.
- My Reports: Reports you created and saved.
- Shared Reports: Reports saved and shared with other users in your organization.
Create New Report
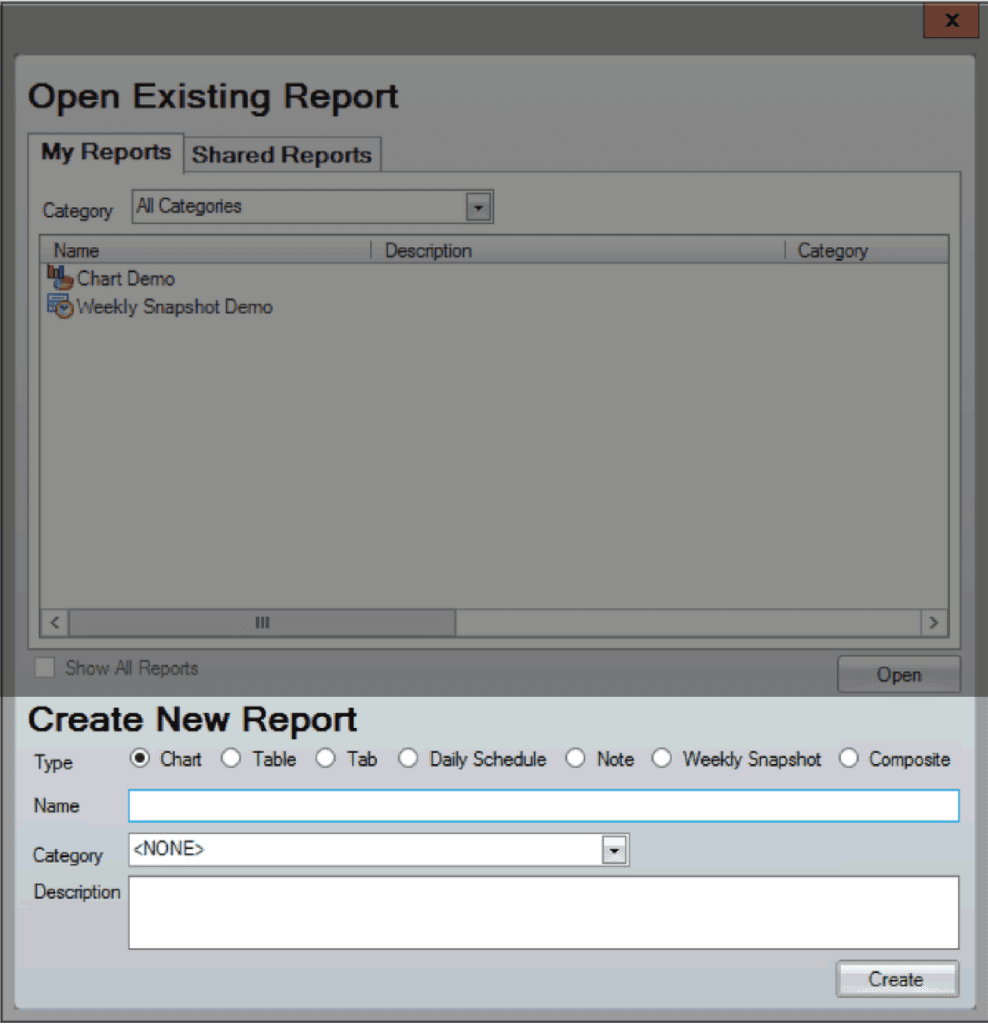
Create a report from scratch by selecting a report type and entering a name, category, and description. Once created, the report can be customized and saved for future use.
- Charts: Displays metrics in a graphical format.
- Tables: Displays data in a structured list format.
- Tab: Builds a table report based on a WWA Task View List (such as Backlog, 24 Hours, or a custom tab).
- Daily Schedule: Create a table report for a specific day.
- Note: Add a text section to a report. Can be used in a composite report to describe or explain specific (e.g. graphic) details.
- Weekly snapshots: Create a table report for a specific week.
- Composite: Combine multiple reports into one pdf for export.
Note: The layout and available options below will vary depending on the report type selected. The screenshots in this section use a Table report.
Parameters
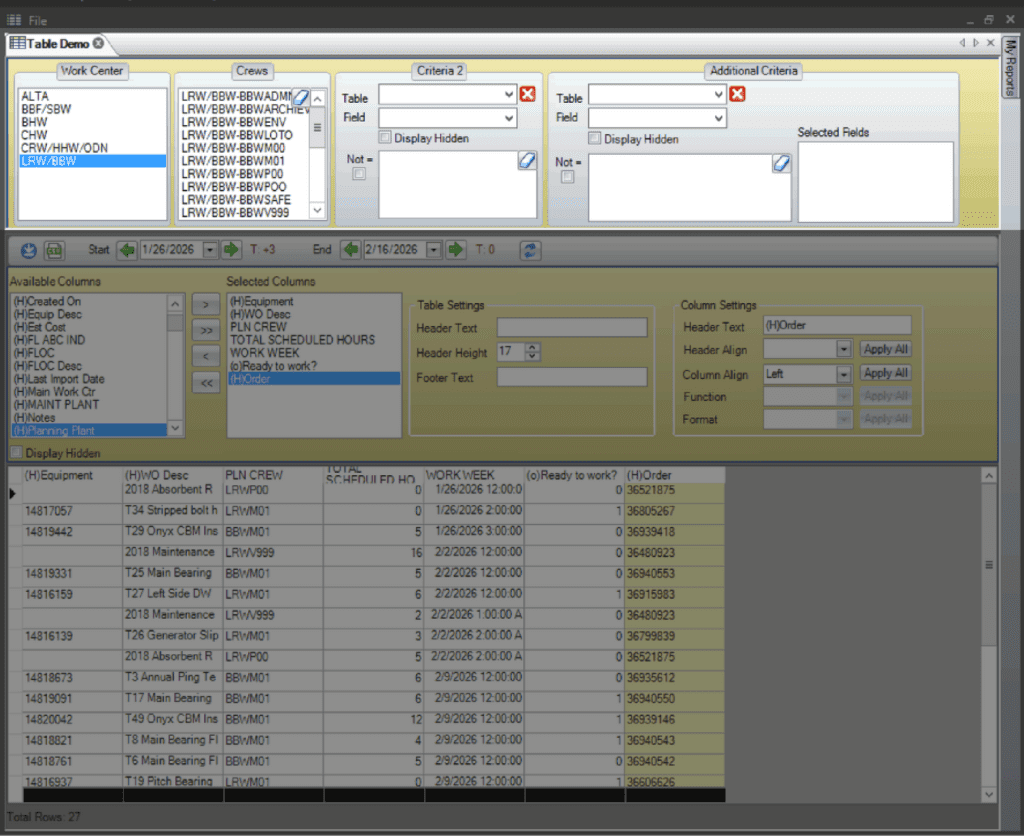
After opening or creating a report, use the Parameters area to define what data the report will include.
- Work Centers: Select the center(s) to run the report for.
- Crews: Select the crew(s) to include.
- Criteria: Apply additional filters based on work order, task, or schedule values.
Export & Date Controls
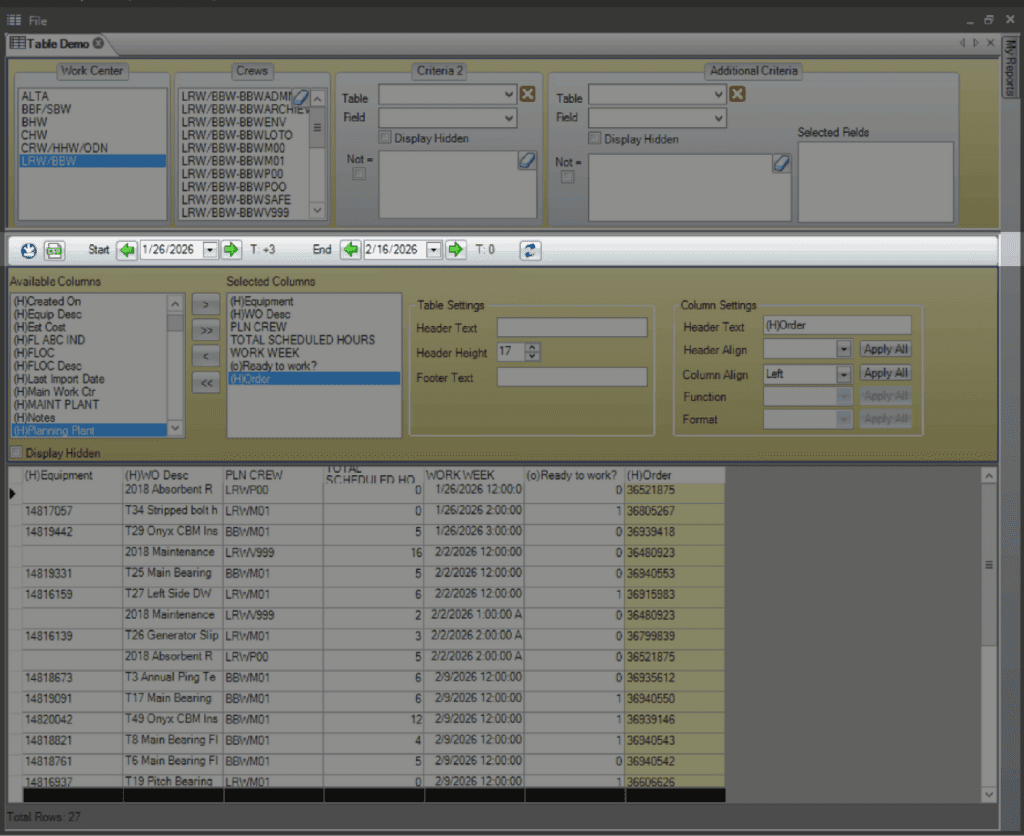
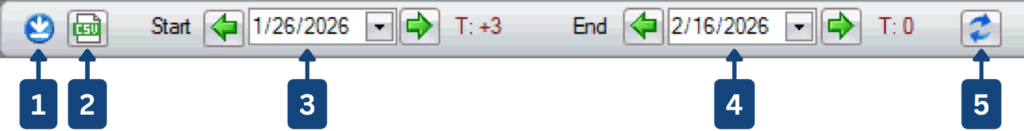
- Autogenerate reports for email or export.
- Save report as a CSV file.
- Select the start date for the report using the T-week arrows or calendar drop down.
- Select the end date for the report using the T-week arrows or calendar drop down.
- Refresh to update the data.
Columns

Select the columns to include by using the arrow buttons to move them from Available to Selected.
Settings
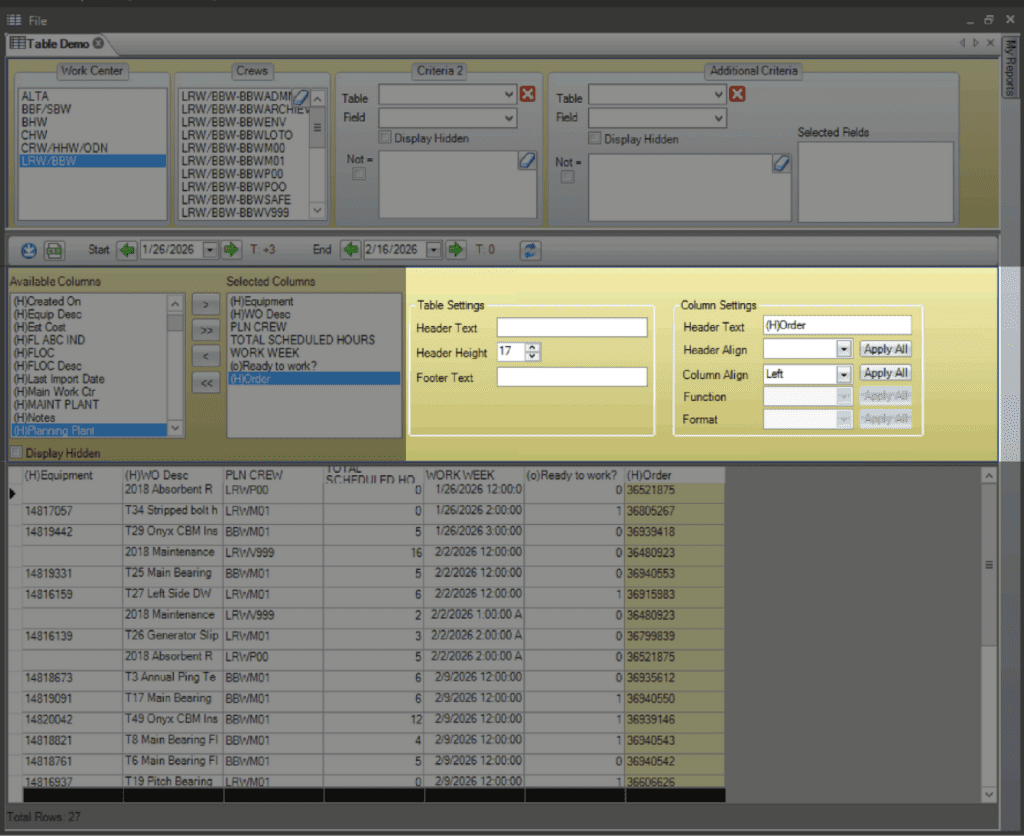
Adjust report layout settings, including header text and data formatting.
Output

Displays selected Column data.
- Select any column to adjust its settings in the setting area.
- Click and drag column headers to re-arrange order.
- Click the column header to sort in ascending or descending order.
Chart Reports
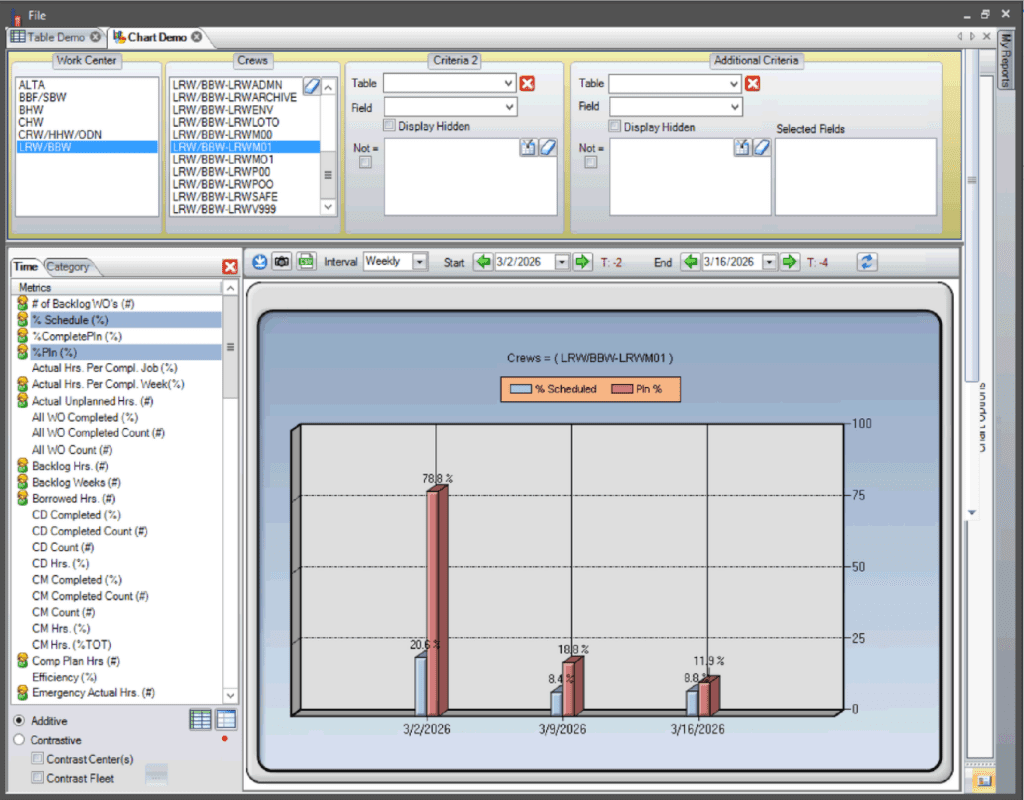
Chart reports follow the same general setup, with one key difference: available metrics are listed on the left side of the screen. Drag and drop the desired metrics into the chart area to build the report. Learn more about how to create a chart report here.