- Open the reports screen.
- Under Create New Report set the report type to Table.
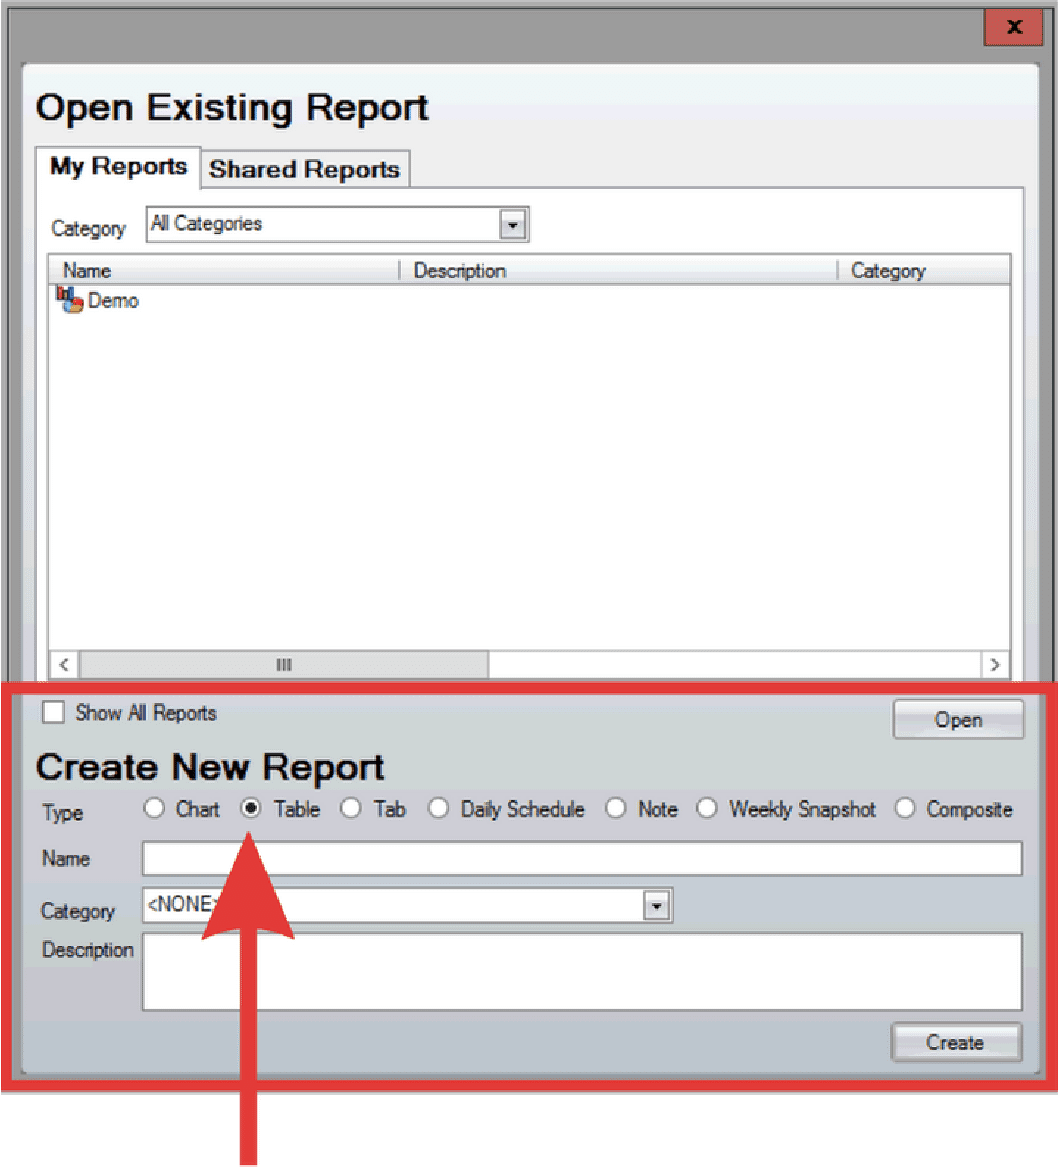
- Alternatively, if the Reports screen is already open, click File > New > Table.
- Input the Table Name and select Create.
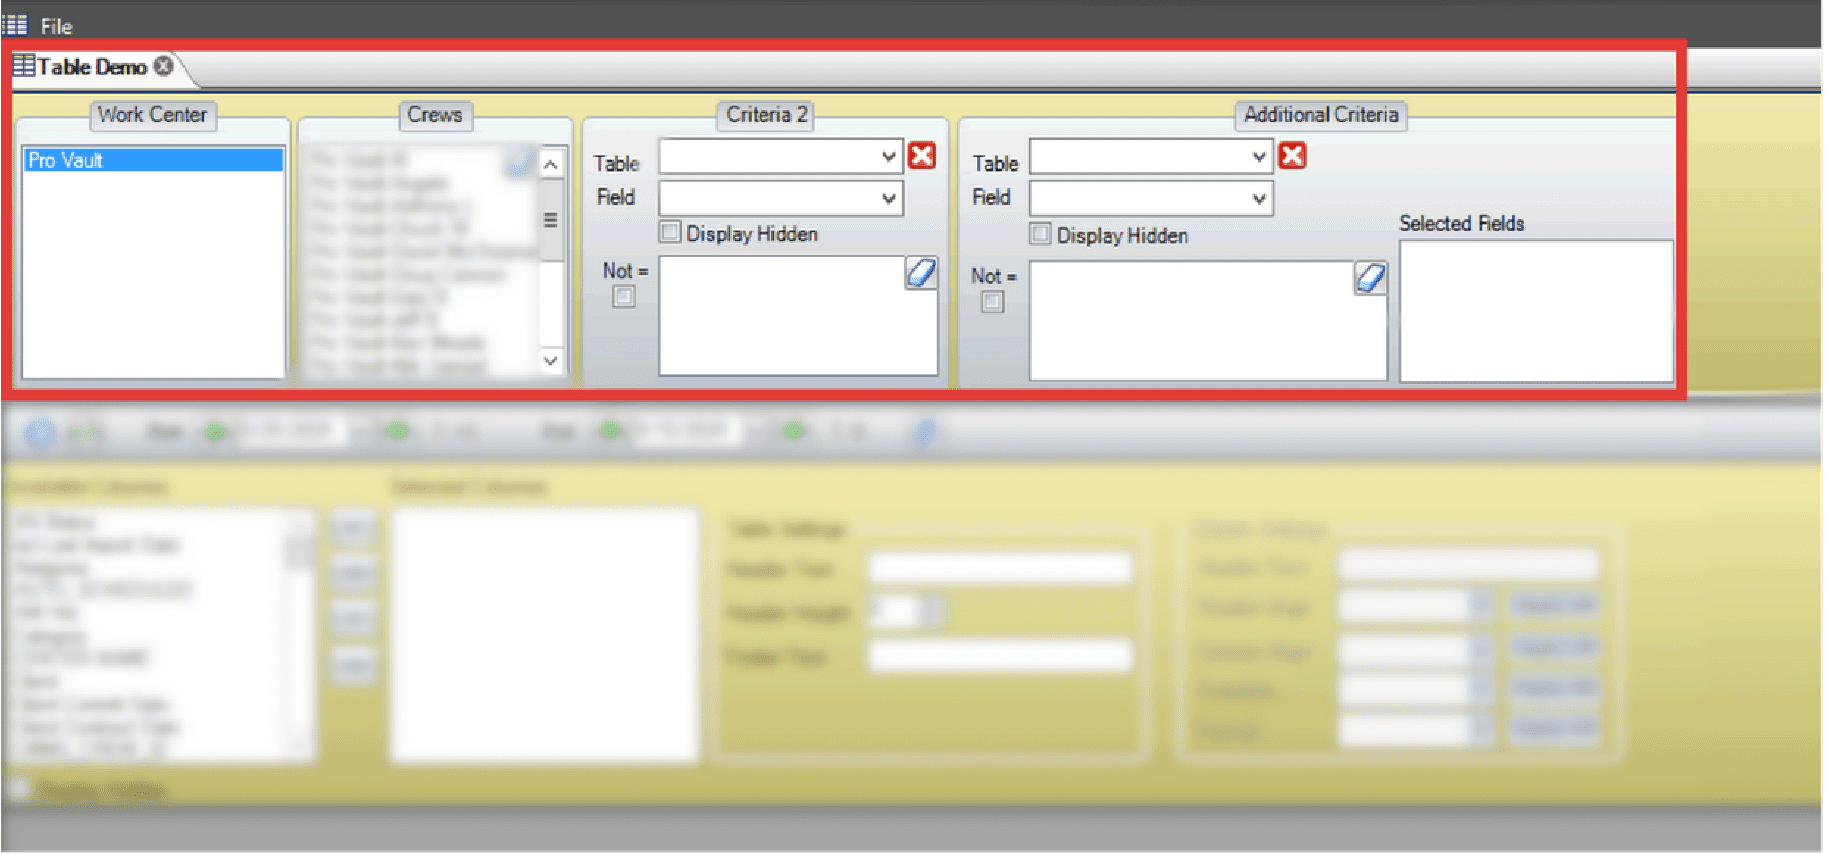
- Select the relevant Centers, Crews (optional) or Criteria (optional).
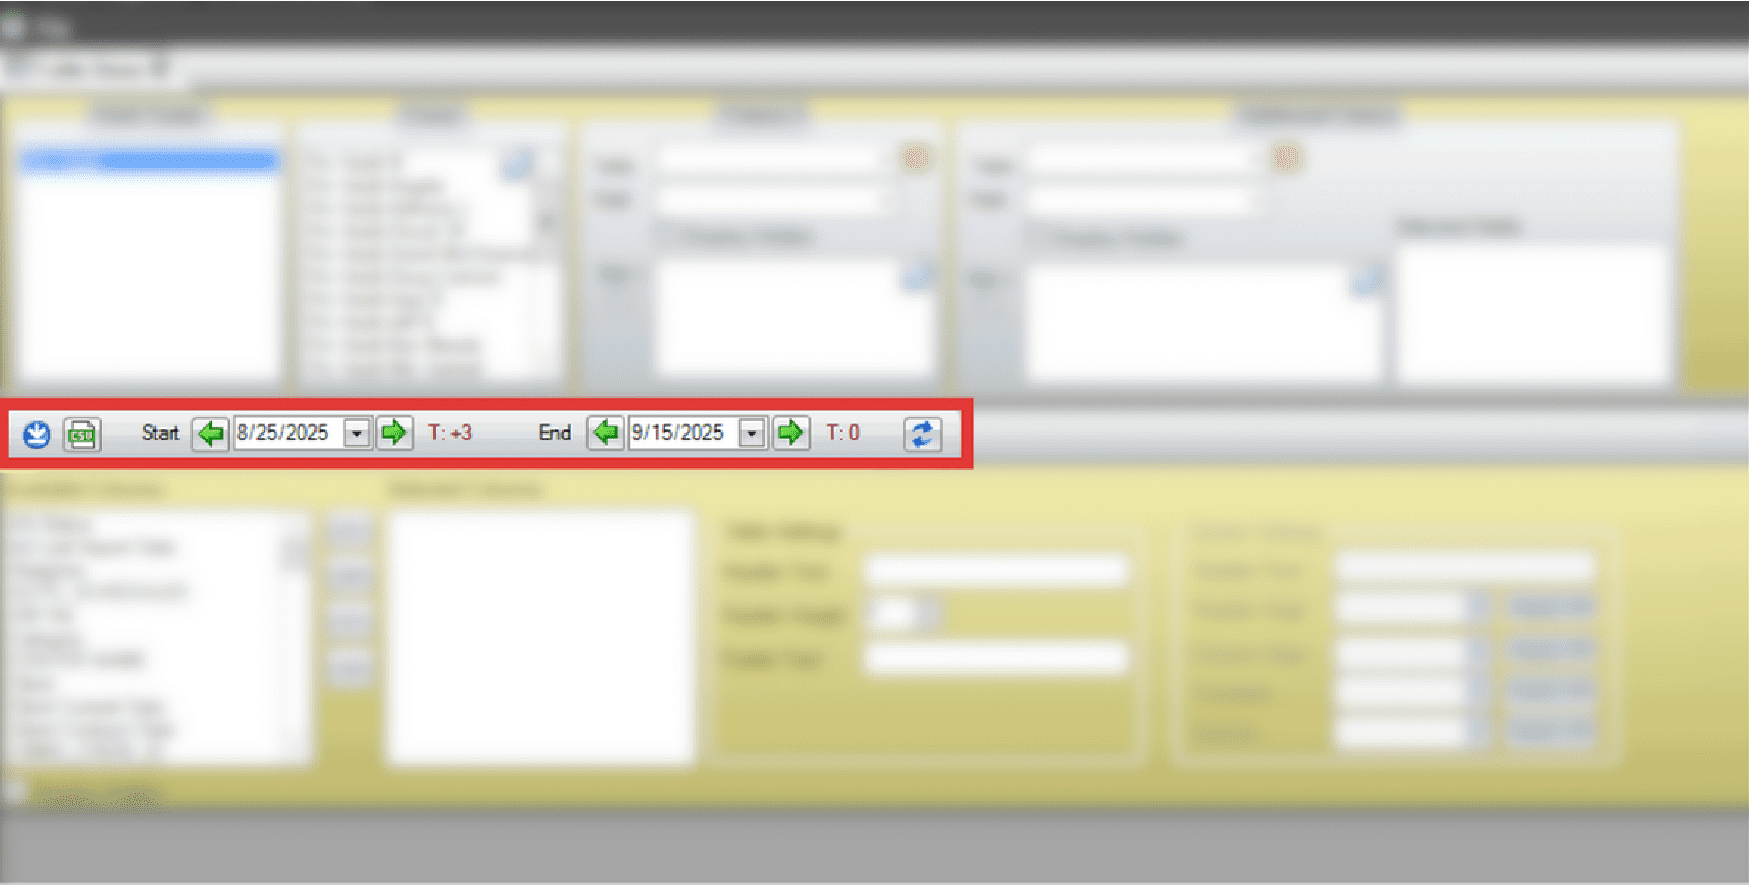
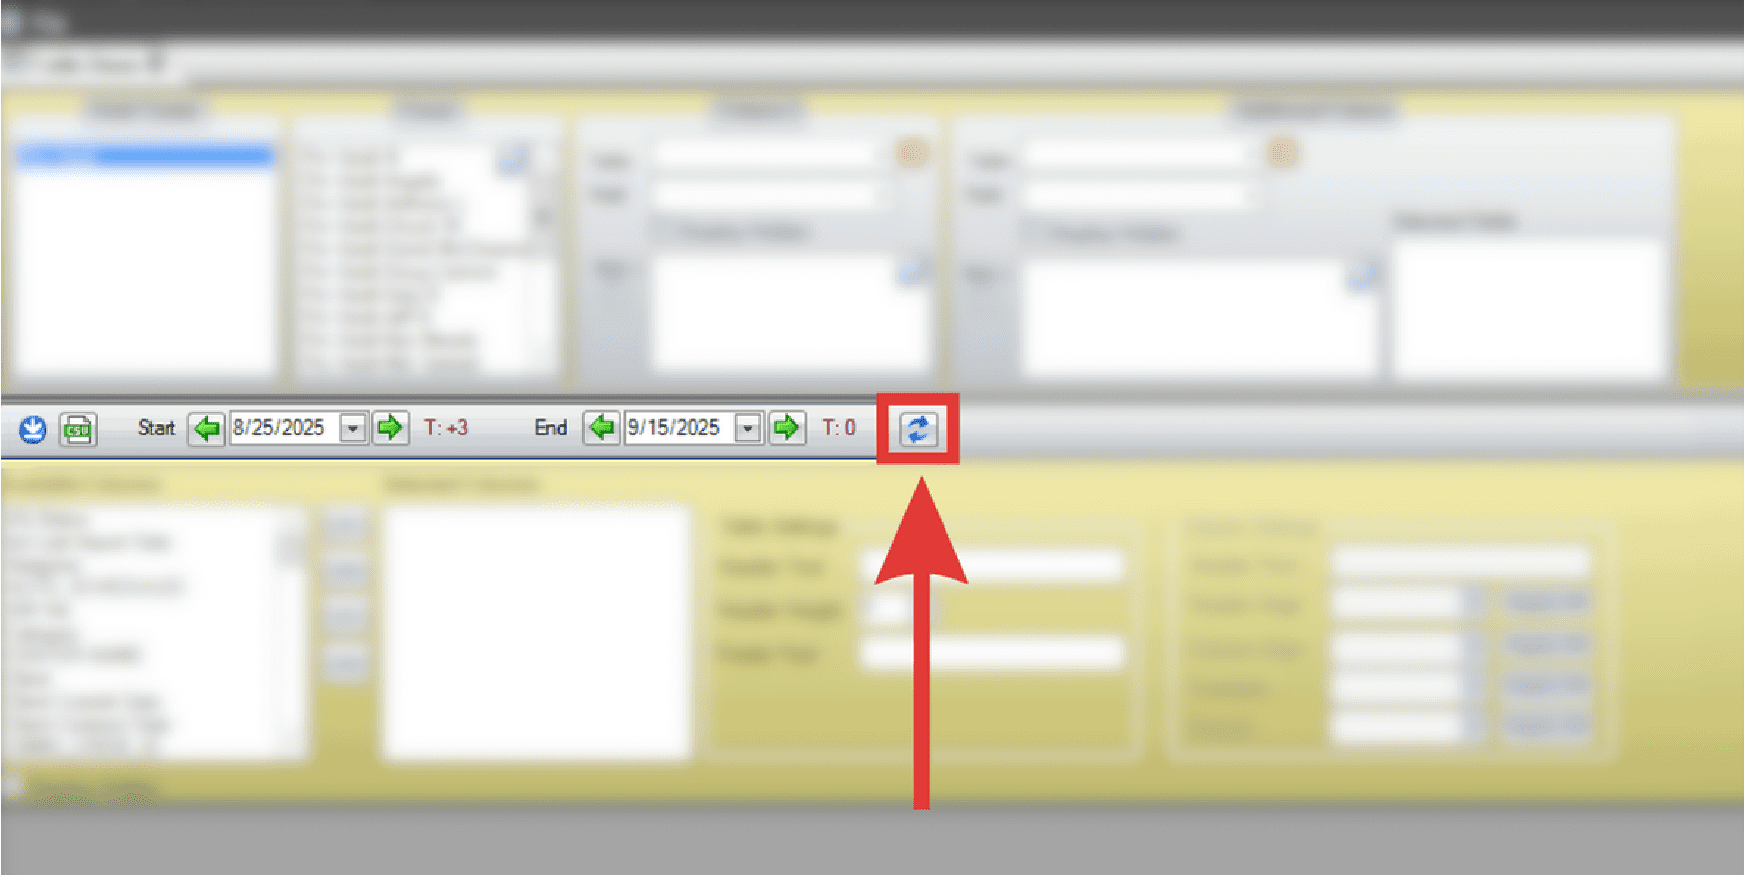
- Choose a date range to define the scope of data.
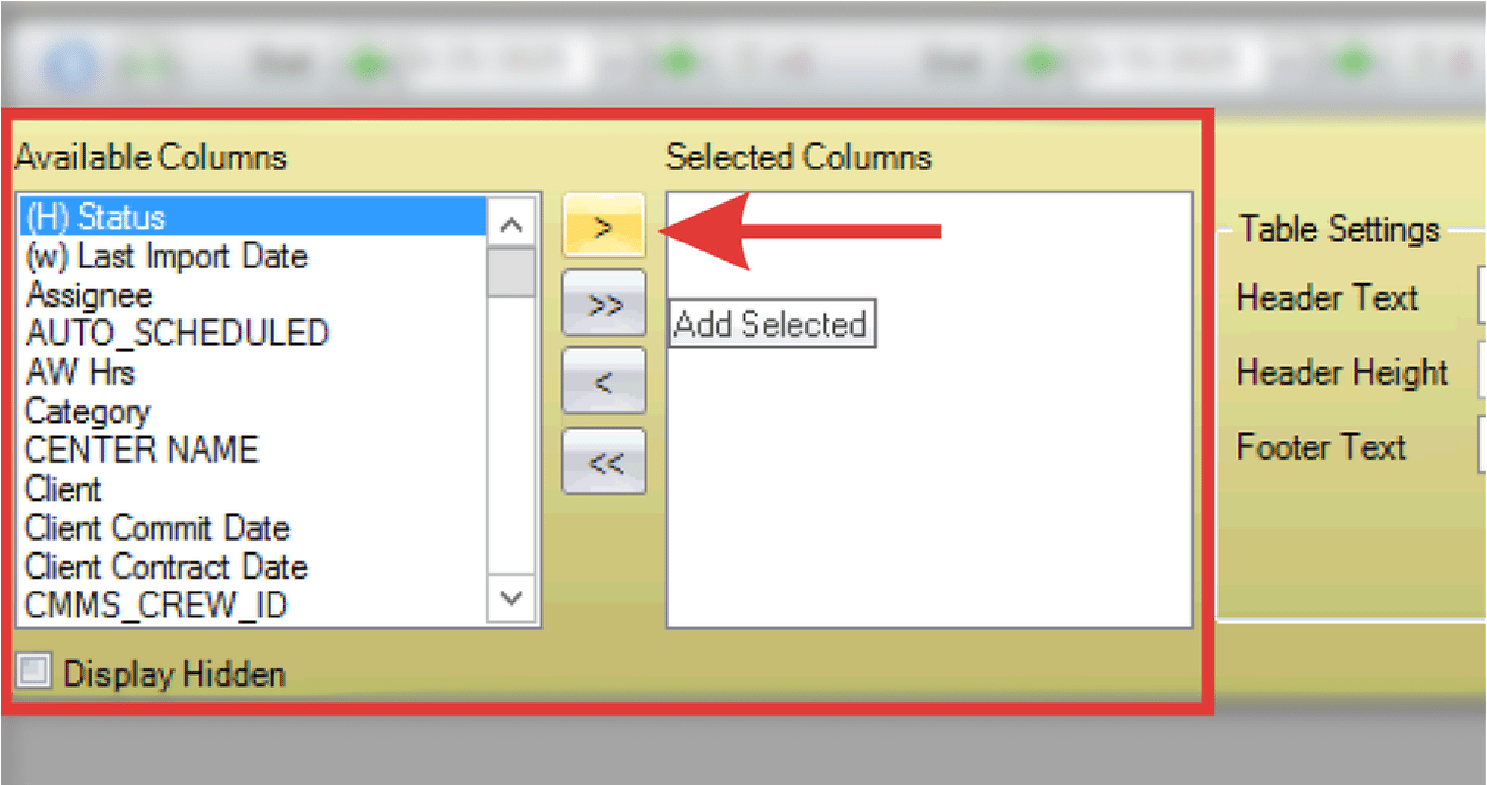
- Select applicable columns from the Available Columns list and use the arrow button to move them into Selected Columns.

- Select the double arrows to move all Available Columns into Selected Columns.
- Adjust column and table settings as needed. Click and drag columns to rearrange as needed.
- Click Refresh Chart to update latest changes.
- Select File > Save when finished.
Reports
Modifying Reports
Output & Automation
How to Create a Table Report
Was this article helpful?